- It is not possible to store the displayed spectrum in a file for later computer processing.
- Getting a hard-copy of the displayed spectrum is not an easy job: Dedicated cameras are scarce and expensive and X-Y plotters cumbersome.
In order to solve these two points, I have designed and built a simple interface to connect my spectrum analyzer to a PC. This unit, named SAN2PC, digitizes analog spectrum data, then processes and transmits that data to a Personal Computer via the RS232 line.
SAN2PC automatically takes care of the spectrum analyzer scan time.
Any terminal program can be used to receive and store RS232 data in a file. This file can be processed afterward, or simply read by any spreadsheet program: The spectrum can then be displayed on the PC screen and a copy printed if needed.
==> Most new PCs don't have any RS232 connector but only USB and can't be connected to SAN2PC. Many RS232 to USB adapters are available so I tried to connect SAN2PC to my computer using a popular one. I learned the hard way that some adapters work but others don't : have a look at the RS232 to USB link elsewhere in this page.
SAN2PC has been tested on my HP141T analyzer, but could be used with other models and brands, insofar as they have analog spectrum voltage and pen lift signal output connectors. I have conducted some tests on a Tektronix 2755P and some builders of SAN2PC use it with different brands and models.
I have also written a dedicated software (in the Python language) displaying not only the spectrum, but also the spectrum analyzer's settings (center frequency, scan width, bandwidth, etc.) on the PC screen. This picture can be stored in a file for future use or printed. The program runs under Windows XP and Win 10 and has been tested under Linux (the Python software I developed is not limited to the Windows world).
==> Important note : SAN2PC does not use the sound card of your PC as some SA interfaces do and thus is not BW limited on the low frequency side. Thus you can select any Spectrum Analyzer ScanTime/div including the very slow ones (up to 10s/div). These slow scantime settings are used when a narrow Resolution Bandwidth is necessary. Sound cards don't pass DC and have a low-pass limit around 20 to 50 Hz : they can't be used for properly (i.e. without distortion) sampling slow ScanTime/div SA signals.


The heart of the circuit is a PIC 18F2525 processor associated with a simple analog interface : Click here to get the schematic diagram
SAN2PC
is connected to the Vertical Output and Pen Lift Output connectors of
the S.A (most analyzers of the kind we are talking about have
such output lines, usually intended for connection to an X-Y plotter).
As
soon as the Pen Lift Output is active (generally a high to low
transition), i.e., during the S.A sweep time, the Vertical Output
signal is sampled by the PIC internal Analog to Digital Converter
until the end of the Pen Lift active state. The sampling period is
automatically computed by the PIC from the Pen Lift duration.
In the
first version, about 1000 samples were stored for each S.A sweep time
and then transmitted to the PC via the RS232 line. This 1000 samples number leads to an operating limit : when the ratio K of the analyzer settings (K = TotalScanWidth/Bandwidth) is
lower or equal to 1000, the RF level measured by SAN2PC is OK. When K
becomes larger than 1000, the probability of sampling outside the
spectrum amplitude peaks increases, thus leading to amplitude
errors.
A new software, SAN2PC rev 2.00, with more than 3000 samples/scan, was therefore developed and is now available Click here for more information
Construction :
-
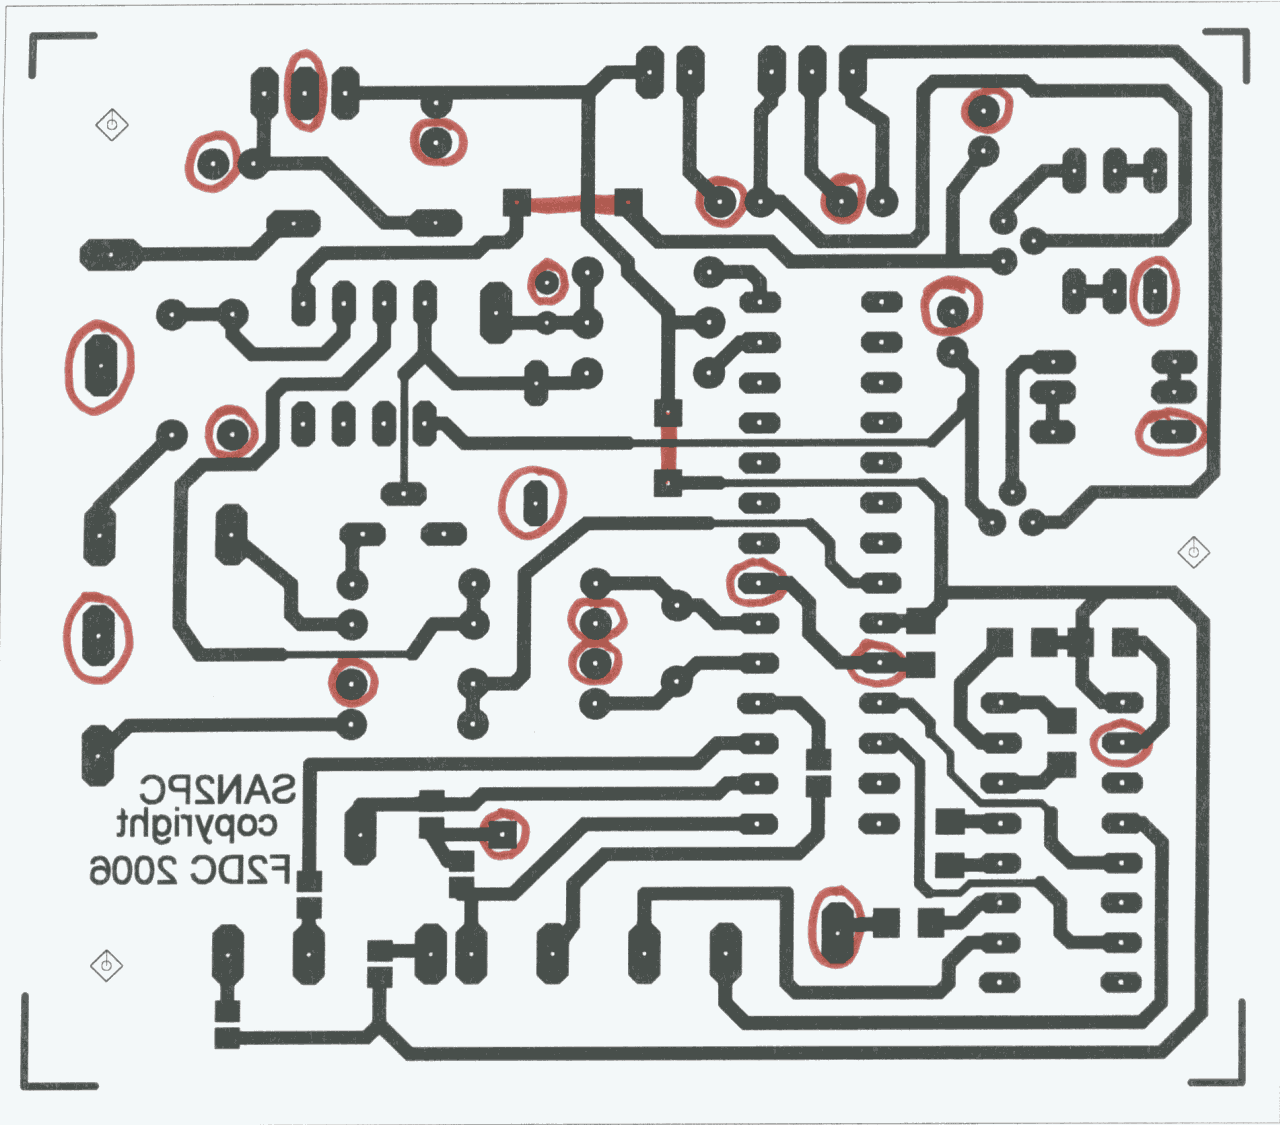
The circuit is built on a dual sided PCB, the upper (components side)
remaining unetched while the lower (solder side) is etched using the
artwork mentioned. The upper side is thus used as the ground plane (see
the above inside picture). As most components pins must be insulated
from ground plane, I use a large drill (6 mm or more) to remove copper
around holes not connected to ground.
The photo below is a close-up of two insulated holes (upper part of the picture) and a grounded hole (lower part).

==> The PCB and preprogramed PIC are available from Far Circuits : look for the 'TEST EQUIPMENT & GENERAL MEASURING INSTRUMENTS' section.
- The file san2pc_gnd_holes.png shows the "grounded holes" and the two wire straps (in red).
-
All components are regular ones except for R7, R8, R13, R14, R16 and
C13, C14, C15, C16, C36, C37 which are SMDs and are soldered on the
lower side of the PCB.
- The DC/DC converter (TMA0512D) is a low cost Single In Line Package made by "TRACO POWER", available from many distributors. You could use another type, but be sure that the
pinout is the same : on some SIP converters, pin 4 (-Vout) and pin
5(Gnd) are swapped!
==> As mentioned in the QEX article, if the Vertical Output voltage of your analyzer is unipolar (positive
or negative only), you could use a TS272 op amplifier (or
equivalent), powered by a single supply (+6.6V), instead of the
TL82 and omit the DC/DC converter U7, the negative regulator U3 and its
related components and the protective diode D7. Don't forget to connect
U4A pin 4 to the ground plane.
Download the PCB design (san2pc_w3c.pdf) by clicking here. (This is a top side view)
The components layout is shown (san2pc_w3c_lay.pdf) in this PDF file.
- An equivalent DC/DC converter can be used instead of the TMA0512D : it is the V Infinity VASD1 S5 D12 .
Note : Buck KC2HIZ tried it but had to use 1 uF in place of the 10 uF capacitors C1 and C2 connected at the + and - 6.6V converter outputs.
Thank you for the information Buck.
- Joop, PE1CQP points out that the MAX232 needs 1uF capacitors. The chip I use in my own SAN2PC is a MAX232A and not the MAX232 shown in the schematic diagram. The MAX232A works well with 0.1uF caps. Thanks Joop.
2.1.1 The PIC embedded software.
The PIC program, named san2pc.c, is written in C language for easier development and debugging. I used the PIC C Compiler proposed by Custom Computer Services (CCS). This compiler is easy to use and a lot of useful tools, as well as sample programs, are available as part of the package.
Programing the PIC was done with a home made programmer inspired by the Propic project and using the WinPIC800 software.
==> The 1000 points software revision is no more available and I strongly suggest you download the 3K samples one (see below) .
2.1.2 The new improved 3K samples SAN2PC rev 2.00.
As above-mentioned, the 1000 samples number leads to an operating limit, when the ratio of the analyzer settings K = TotalScanWidth/Bandwidth is larger than 1000.
We
can increase the samples number to mitigate this issue : however we are
limited by the size of the PIC internal SRAM (#3900 bytes) and by the
data transmission time from SAN2PC to the associated computer.
I thus modified the SAN2PC file format as follows :
-
The samples number is now around 3000 points, compatible with the
available PIC internal memory (it's the reason why I selected this PIC
chip!).
- There are no more any frequency information associated
with each sample : each frequency is computed by the Drawsan program
from the start and stop frequencies found in the header data : we thus
save a lot of transmission time.
- The amplitude data for each
frequency is now the A/D generated byte and not the RF power in dBm,
thus lowering the transmission time too. The dBm calculation is done
later by the PC plotting software.
- The file format being
different from the one generated by the first SAN2PC revision (e.g.
1.14 and earlier), Drawsan must have a way to know if the file
processed is a new or an old type. The header of the new data files is
preceded by the figure '2' to point out that it has been generated
by a rev. 2.0x SAN2PC software.
- Because of the larger samples number, it is necessary to select a Spectrum Analyzer ScanTime/div equal or greater than 10 ms before running SAN2PC.
Click here to download the 3000 points san2pc200_g.zip file and Click here to download the new SAN2PC User's Guide rev 2.00_2
2.2.1 The PC plotting software.The plotting program named Drawsan relies on the header of the file sent by SAN2PC via the RS232 or USB line
and stored on the PC hard disk : this header includes main analyzer
settings (Reference Level, Center Frequency, Scan Width,...). I chose
to write it in the Python language mainly because of the availability of a first-class graphics library, Matplotlib available from the Sourceforge site. I would like to acknowledge Joe HOPSTER who wrote the interpolated frequency computation.
- The old 1000 points revision (drawsan114.zip) is still available for those of you using the old 1K samples files (click here to download it).
Important note : Before using drawsan.py, you must install Python of course, but also the Matplotlib and Numpy libraries.
==> A Python Installation and Drawsan user's Guide (rev 2.2) is available (Click here to download)
This version works only with the 3000 points files created by the new SAN2PC rev. 2.00 and the user is warned if he tries to process an old file type with this new Drawsan.
Click here to download the drawsan200_1.zip file
Thus he modified the Python source code and gave me the authorization to propose his work (Drawsan 2.01B) to other interested people. His batch file is included in the zip file. Thank you very much, Buck !!! Click here to download his Drawsan201B-Batch.zip
2.2.3 The Drawsan rev. 3.01 for use with Python 3.10
==> March 1st, 2022 : I wrote recently a new Drawsan version 3.01 working with Python 3.10
and I have tested it with Matplotlib 3.5.1 and Numpy 1.22.2. There are
some differences in the program because some instructions used in the
old Python 2.7 version are not available in the new 3.10 one.
Click here to download this new Drawsan301.zip file
2.2.4 Some notes about Drawsan
==> Note : If you want to test the Drawsan program without building the SAN2PC hardware, just download the test2.zip file. This file was generated by SAN2PC and you can play with Drawsan. You'll see the spectrum shown below on your PC screen :
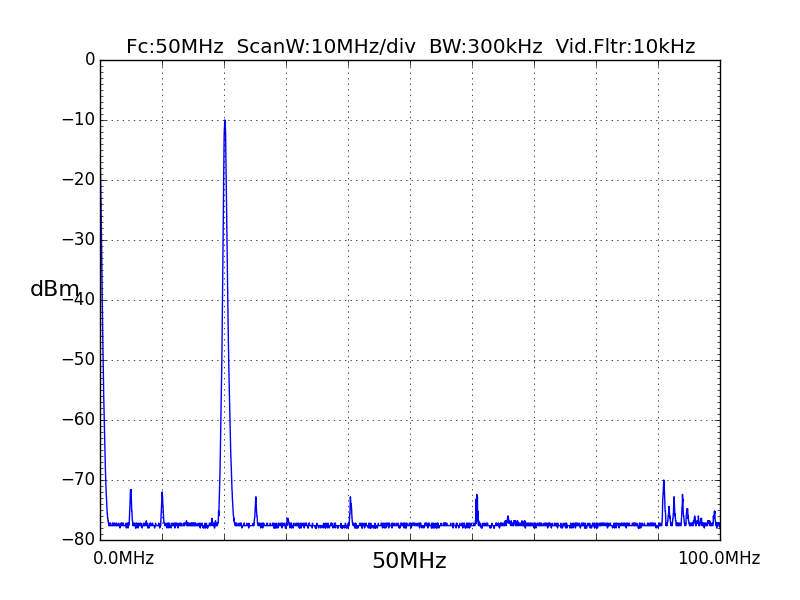
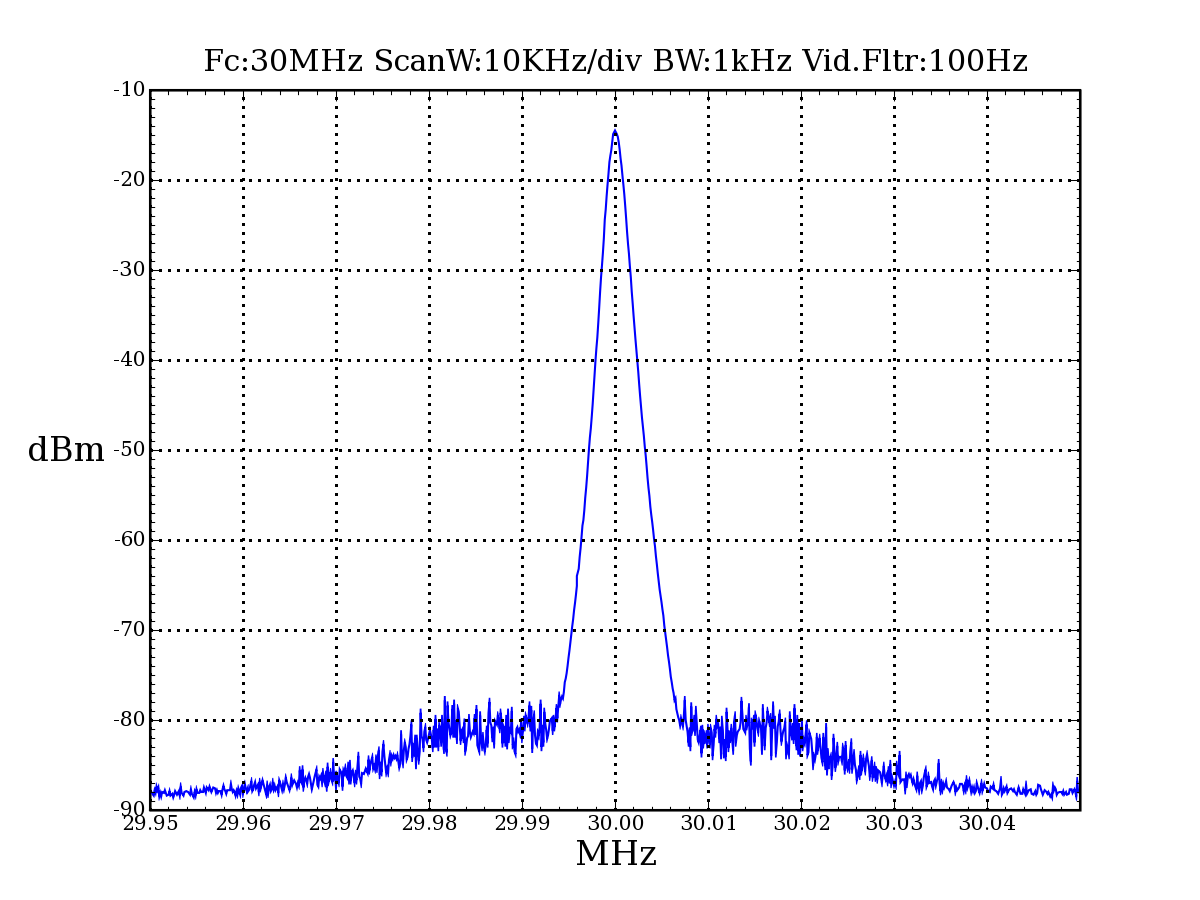
Some other pictures of spectra plotted with drawsan.py are shown below (click on the pictures to enlarge). The analyzer settings are automatically displayed in the upper part of the picture.

3. Some comments about RS232 to USB converters (January 2014).
Most
new PCs don't have any RS232 connector but only USB, thus they can't be
connected to SAN2PC. Many RS232 to USB adapters are available, so
I tried to connect SAN2PC to my computer using a popular one.
It is
the cheap "blue USB to RS232 cord" sold in many stores on Ebay. This
cable claims to be based on an IC made by Prolific Technology Inc.
Tests with SAN2PC show it doesn't work at a 115.2 Kbauds data rate because many data are lost during the transfer to the PC.
However it seems to work when the speed is 9.6 kBauds, but the transfer time is a lot longer!
I
discussed these results with my son Lionel : after some research on the
Internet he found that other people find the same weird behavior. It
seems that the Prolific IC used in this adapter is a fake one that does
not perform like a genuine one!
He purchased and tested several other RS232 to USB adapters (various brands and models) and published the results on his Web site:
http: //lionel.cordesses.free.fr/gpages/usb08.html
You'll find there the method he used and his findings.
The safe, nevertheless cheap way to go, is to use USB to serial adapters with TTL levels. "
If you want to use such a TTL converter, you have to remove the MAX232A IC from its socket and put a strap between pin 10 and pin 7 and another one from pin 12 to pin 13 on the socket.
You'll then connect the TTL RS232-USB converter lines to the Transmit and Receive lines of the SAN2PC RS232 connector.
- QEX article (2.3 Mbytes PDF).
- Schematic diagram.
- PCB artwork. (san2pc_w3c.pdf)
- Components layout. (san2pc_w3c_lay.pdf)
- Grounded holes and wire straps. (san2pc_gnd_holes.png)
- SAN2PC200.hex PIC zip file. (March 2009)
- SAN2PC User's Guide rev 2.00_2 (Jan. 29, 2010)
- How to install Python and use Drawsan Guide (rev. 2.3) (#300 kbytes PDF)
- Python program Drawsan200.1 zip file (April 27, 2009)
- Drawsan 201B_Batch.zip courtesy of Buck KC2HIZ (April 30, 2010)
- Python program for use with Python 3.10 : Drawsan301.zip file (March 1, 2022)
- Simple Python program test file (simpleprog.py)
- Test2.zip file
This simple interface may help to solve the hard-copy problem associated with many secondhand old spectrum analyzers. It also provides the user with a file for subsequent computer processing.
It could probably be used with other equipment, like old network analyzers, that don’t have any printing function but only analog output connectors.
==> Your comments about SAN2PC and Drawsan programs are welcome !